Remote debugging production PHP applications with XDebug
Remote debugging production PHP applications with XDebug
In this post we will see how to debug a remote PHP based application using XDebug and SSH tunnels, with a setup that can be used even on production environments (because, yes, some edge case issues will only appear in production).
Xdebug on production environments? This is a no-go on most situations. But sometimes there is no other alternative. Directly hooking into a production environment to dig through an issue that you cannot reproduce locally can save you a lot of time, and reduce your application downtime.
For this post I assume that you are already familiar with XDebug and how it works.
The first thing we need to do is enable XDebug on the production environment. In order not to impact the environment, we will enable the extension in a dormant mode and only enable the debugging feature for requests coming from a specific domain.
To enable XDebug in a dormant state, use a configuration similar to this one in your php.ini:
[XDEBUG]
zend_extension=php_xdebug.dll

xdebug.profiler_enable = 0
xdebug.profiler_enable_trigger = 0
xdebug.profiler_output_dir = "D:\_Webs\mywebsite\runtime\xdebug_profile"

xdebug.remote_enable = 0
xdebug.remote_mode = req
xdebug.remote_log = "D:\_Webs\mywebsite\runtime\xdebug_remote\20170116_091308_log.txt"

xdebug.default_enable=0
xdebug.coverage_enable=0
xdebug.trace_enable_trigger=0
xdebug.auto_trace=0
xdebug.collect_includes=0
# extended needed to set breakpoints. Makes application slower and oparrays biger.
xdebug.extended_info=1
xdebug.trace_output_dir="D:\_Webs\mywebsite\runtime\xdebug_trace"
We will now use an imaginary domain where we will enable XDebug remote debugging:
[HOST=debug.mysite.com]
xdebug.remote_enable = on
xdebug.remote_handler = dbgp
xdebug.remote_host = 127.0.0.1
xdebug.remote_port = 9000
xdebug.remote_mode = req
# User your IDE key here
xdebug.idekey="php-vs"
xdebug.remote_connect_back=0
The next step is to enable SSH on your server.
To do this manually on a Windows Server get a copy of a compiled OpenSSH:
https://github.com/PowerShell/Win32-OpenSSH/releases/
Extract the package to a convenient location such as:
d:\openssh
Open a privileged command prompt and use the following to install SSH as a Windows service:
powershell.exe -ExecutionPolicy Bypass -File install-sshd.ps1
Generate server keys by running the following commands from d:\openssh:
.\ssh-keygen.exe -A
Open a port for the SSH server in Windows Firewall (port 22):
powershell.exe New-NetFirewallRule -Protocol TCP -LocalPort 22 -Direction Inbound -Action Allow -DisplayName SSH
Start the service and/or configure automatic start:
- Go to Control Panel > System and Security > Administrative Tools and open Services. Locate SSHD service.
- If you want the server to start automatically when your machine is started: Go to Action > Properties. In the Properties dialog, change Startup type to Automatic and confirm.
- Start the SSHD service by clicking the Start the service.
Now that we have SSH service running on the server, we will use native Linux tools to connect to the server. Install the native Linux bash for Windows (only available since Windows 10 Annivesary Update).
http://www.howtogeek.com/249966/how-to-install-and-use-the-linux-bash-sh...
Open a Linux Console and and install the open ssh client (only once):
sudo apt install openssh-client
Now open a tunnel:
ssh -R 9000:127.0.0.1:9000 username_goes_here@hostname_goes_here
Notice that we used 127.0.01 instead of localhost. The username to use is one that belongs to a Windows account in the remote server.
Once you are connected (and tunneled) you will se a remote command prompt.
Before we can debug the remote application as if it was local, remember we enabled XDebug debugging only for an imaginary host "debug.mysite.com". Just add a local loop to our imaginary host in the "hosts" file (do only once in an elevated prompt):
echo 166.25.45.55 debug.mysite.com >> %WINDIR%\System32\Drivers\Etc\Hosts
Here you need to use the public IP address of your production application.
You also need to make sure that your remote server will route requests to this domain into your IIS application, so that browsing "debug.mysite.com" on your local computer will load the production site.
To confirm that the setup is working, open a browser and navigate to "debug.mysite.com". Your production site should be showing here.
If the debugger fails to connect you can also look at the remote logs configured in:
xdebug.remote_log = "D:\_Webs\mywebsite\runtime\xdebug_remote\20170116_091308_log.txt"
Just make sure that the folder this log points to does exist, otherwise PHP will fail to create the log file.
You might also need to make sure path mappings for your IDE debugger are correct. It is not uncommon for production environments to have startup code (with application environment data) set through a prepend file in php.ini:
auto_prepend_file =D:\_Webs\mywebsite\runtime\loader.inc
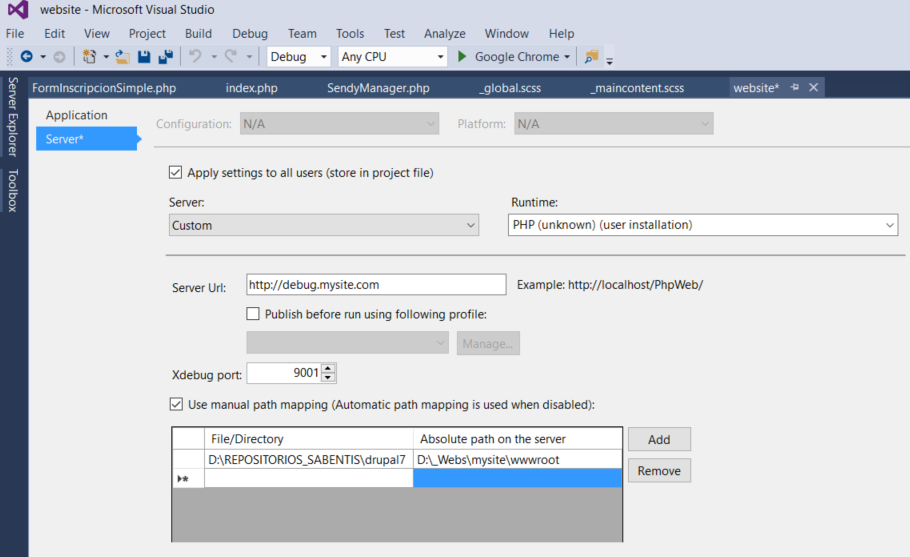
Just make sure that you define manual mappings for your remote and local directories that represent your web project.
For example, the remote site root is in:
D:\_Webs\mywebsite\wwwroot
While the local project has the root code in:
D:\REPOSITORIOS_SABENTIS\drupal7
So we add a custom mapping to make sure the debugger is able to find the right files:

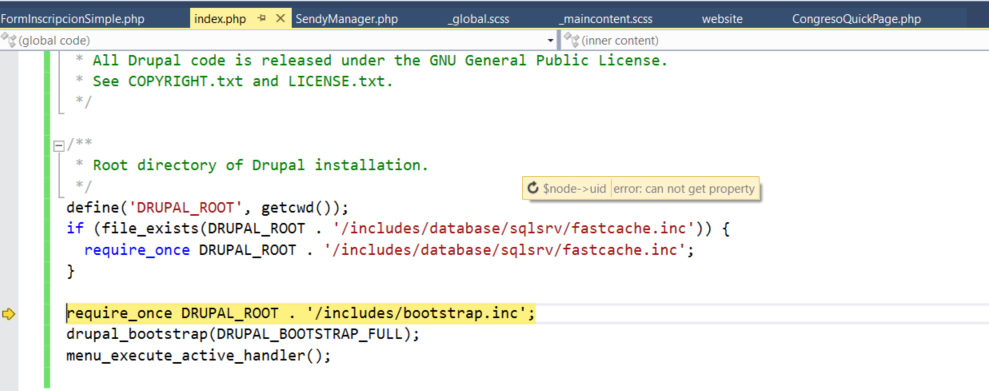
You are now ready a remote debugging session!


Add new comment